Stacked Value Bar Graph


Stacked Value Bar Graph |
|
|
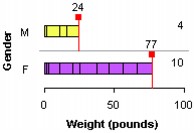
Stacked Value Bar Graph This graph displays the total of all the case values of a numeric attribute as a single bar. Each case appears as a separate section of the bar. The example shows 13 male cats weighing a total of 157 pounds while 13 female cats weigh 128 pounds in total.
To make a stacked value bar graph,
In the example, another attribute, Gender, was added to the vertical axis (drag the attribute name to the vertical axis), the number of cases of each gender were displayed (click the Counts (n) button in the upper plot toolbar), and two reference lines were added to help you read off the length of the two bars (click the Ref. Vertical button in the upper plot toolbar and access the menu to the right of the button to add a second line).
|